
Ad Campaign Analysis Project
May 30, 2025
Project Overview #
This project analyzes advertising campaign performance using SQL and Tableau. Starting from a raw dataset, I performed data cleaning, added simulated dirty data for realism, and built custom KPIs to uncover key trends.
The focus is on understanding campaign efficiency, ad spend distribution, and how different spend tiers impact outcomes.
Business Value #
Marketing teams often struggle to know if their ad spend is actually delivering value. This project helps:
- Visualize which spend tiers are most efficient
- Identify underperforming vs. outperforming campaigns
- Guide smarter investment decisions based on data, not assumptions
Key Features #
Dirty Data Simulation
Injected nulls, typos, and inconsistencies to simulate real-world messiness.Custom KPIs
Total Spend, Products Sold, and Products per Dollar.Z-Score Efficiency Metric
Highlights above- or below-average performance by campaign.Insightful Dashboards
Tableau dashboards surface trends by spend tier, ROI, and more.
Visual Highlights #
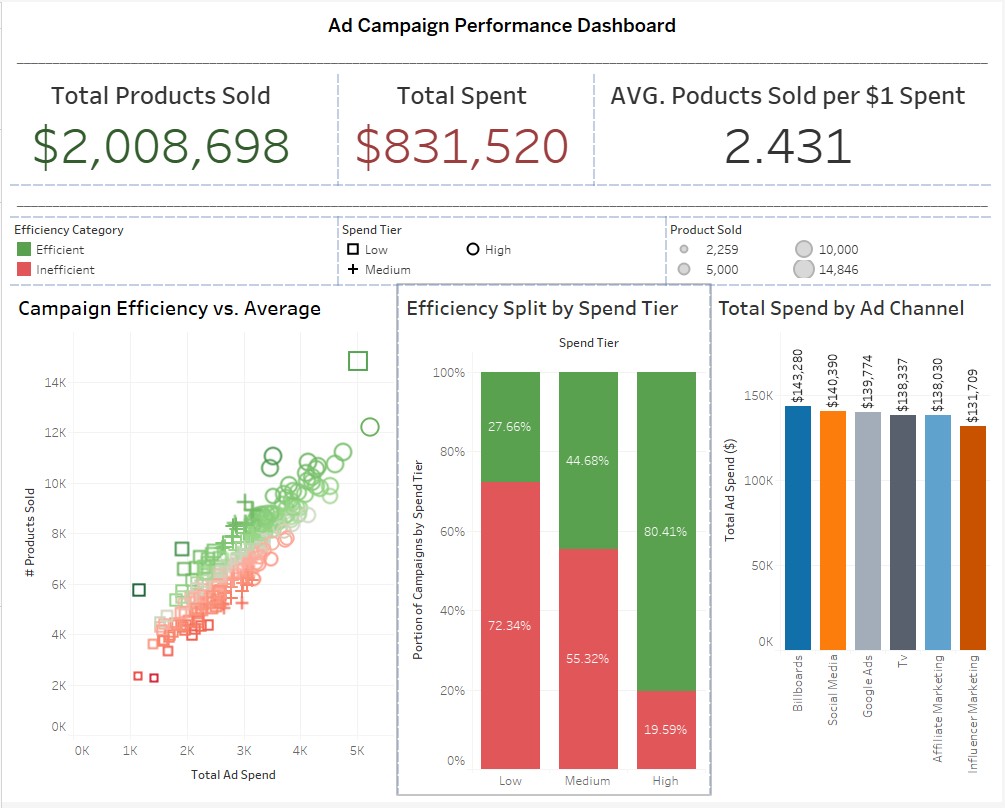
Final Dashboard Overview #
A full view of spend, product sales, and campaign efficiency metrics.
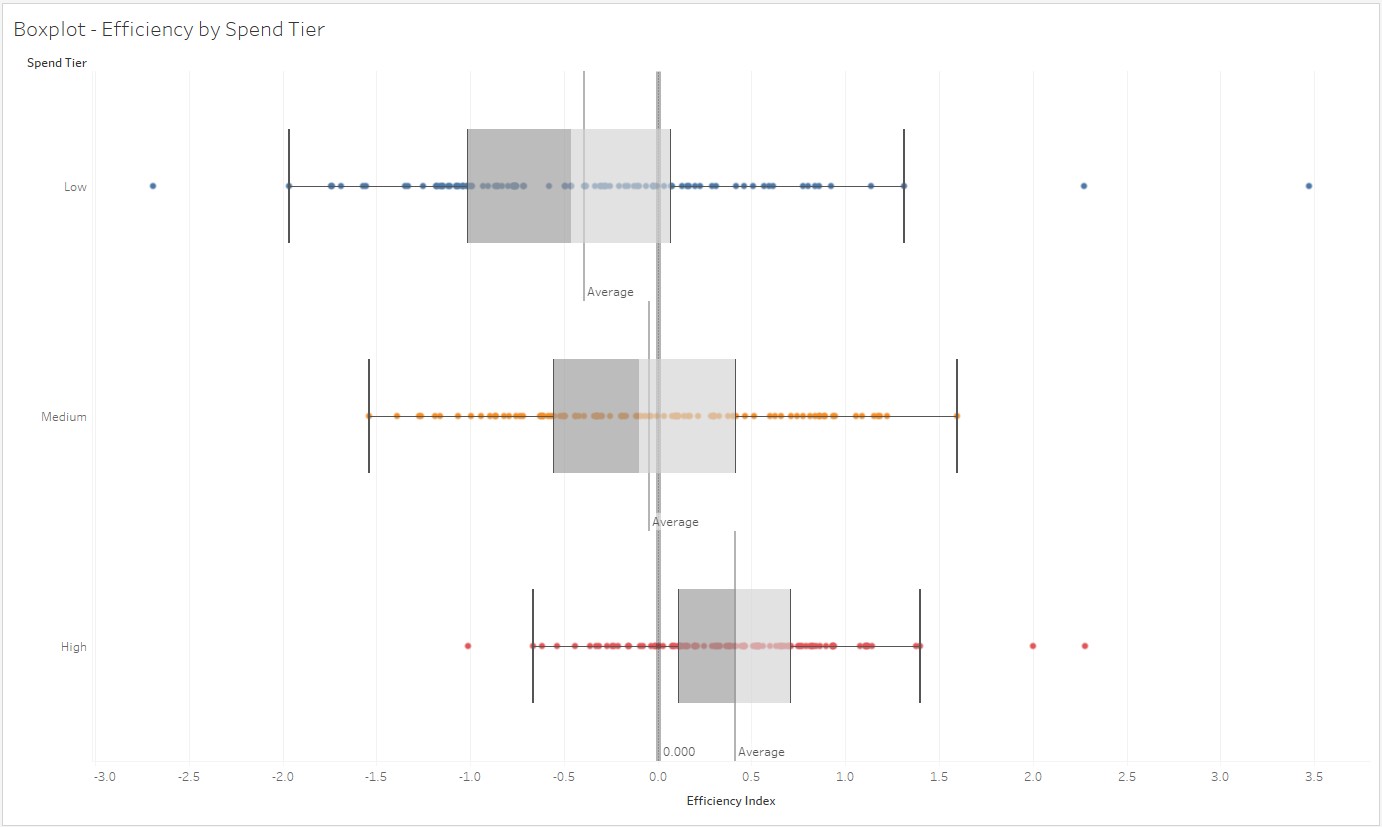
Efficiency Outliers #
This boxplot shows variance by spend tier and reveals a handful of high/low performing outliers.
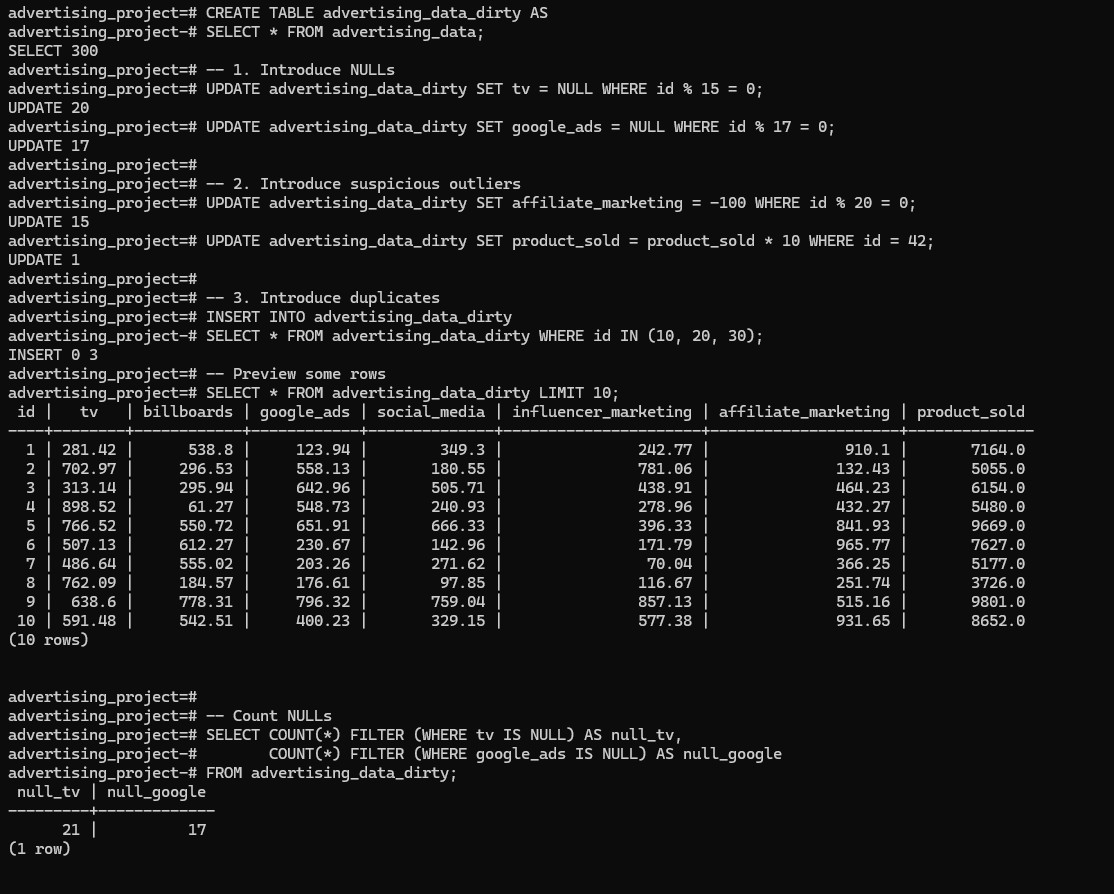
Simulated Dirty Data #
Nulls, typos, and inconsistent casing were added to demonstrate realistic cleaning needs.
Tools Used #
- SQL (PostgreSQL)
- Tableau (visual dashboards + storytelling)
- Python (for quick preview and validation)
- Simulated dirty data techniques
Try It Yourself #
What I Learned #
This project helped me:
- Practice real-world data cleaning with dirty data scenarios
- Translate SQL outputs into executive-friendly Tableau dashboards
- Develop and explain custom metrics like product per dollar and efficiency index
- Tell a clear data story using Tableau Story format
Last updated on May 30, 2025